Manufacturing Issues
Spot Welding of Three Steel Sheets with Large Thickness Ratios
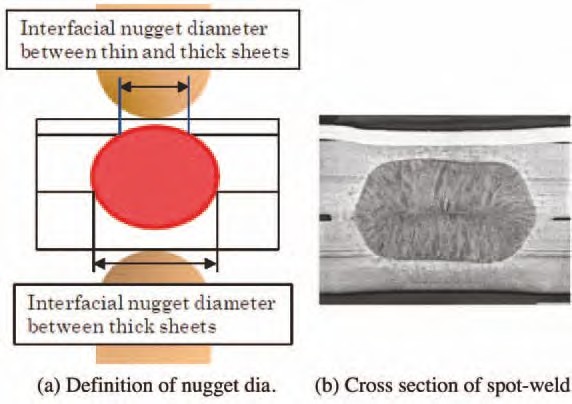
Car parts such as side panels are fabricated by spot welding three steel sheets together. When the outer steel sheet is a thin sheet of mild steel and the reinforcement steel sheets are thick sheets of HSS (that is, when there is a large thickness ratio between the sheets), it is often difficult to spot weld such sheets together. The term “thickness ratio” as used herein refers to the total thickness of the three steel sheets divided by the thickness of the thinnest steel sheet. Nuggets obtained by spot welding of three steel sheets are illustrated in Figure 1 (a). In the spot welding of three steel sheets with a large thickness ratio, it is difficult to form a nugget at the interface between thin and thick steel sheets, as shown in Figure 1 (b). The reason for this is that in spot welding, because of heat removal by the water-cooled electrode, the fusion progresses from the thickness center of the three steel sheets toward the outside, except for the heat generated by contact resistance at the steel sheet surfaces in the early stages of welding time. In addition, in view of the dimensional accuracy of actual members, it is necessary to set appropriate welding conditions when there is a gap between steel sheets. In practice, the proper welding current range is as shown in Figure 2. However, the welding current range is often narrower in one-step spot welding.
Figure 1: Three sheets spot welded.N-5
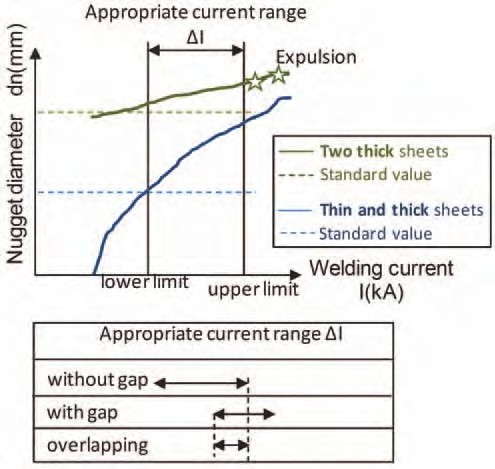
Figure 2: Weldability lobe of three sheets spot welded.
As a means of solving the above problem when there is no gap between the steel sheets, a method has been proposed in which the diameter of the electrode tip at the thin-sheet side is reduced and the welding force and current are varied during the welding time. In addition, a two- step pulsating current welding method (Figure 3) has been proposed in which neither the electrode diameter nor the welding force are changed. This method is described briefly below. Initially, during the first welding step, a relatively large welding current is passed to generate heat by using the contact resistance at the interface between the thin and thick steel sheets and that between the thick steel sheets. This method does not positively use the contact resistance that is effective when the electrode force is low. Since the method can be applied even under a high electrode force, it is particularly effective when there is a gap between the steel sheets to be welded together.
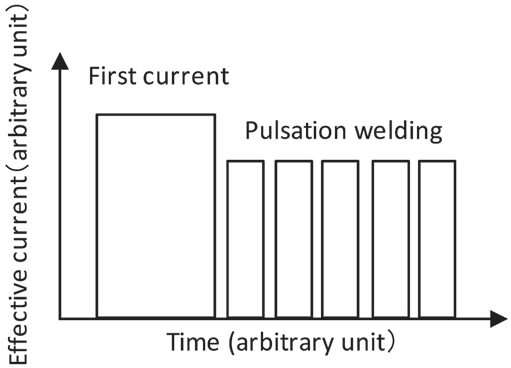
Figure 3: Welding current pattern.
An experiment was conducted by using the above technology. The materials used were a 0.6- mm-thick sheet of mild steel and two 1.6-mm-thick sheets of HSS (980 MPa class). Spacers 1.4-mm thick were inserted at intervals of 40 mm between the thin and thick steel sheets and between the thick steel sheets. A servomotor-driven, single-phase AC welder was used for the test. The electrode used was a Cr-Cu dome radius type with a 40-mm tip upper radius and 6-mm tip lower diameter. The welding force was 3.43 kN. To evaluate the diameter of fusion at the interface between the thin and thick sheets, which determines the proper current range, a chisel test was conducted at the interface and evaluated the plug diameter.
The test results are illustrated in Figure 4. The horizontal axis represents the first step welding current for one-step welding (welding time t1 = 18 cycles) and the second-step welding current for two-step welding (first welding time t1 = 18 cycles, second welding time t2 = 8 cycles) or pulsation welding [t1 = 18 cycles, t2 = (5-cycle heat/2-cycle cool) × 5]. For one- or two-step welding, the welding current range was less than 1 kA. Conversely, with pulsation, it was possible to secure a proper welding range of 3 kA or more (about 1.8 kA when there was no gap between the steel sheets).
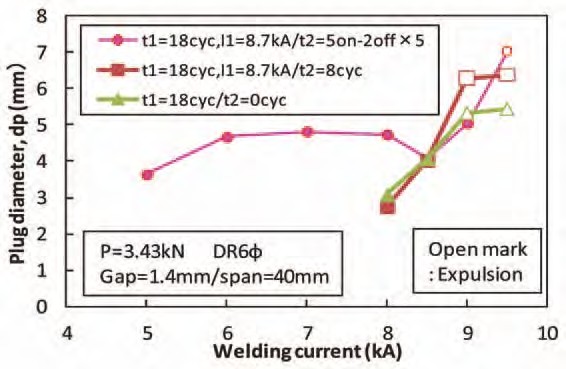
Figure 4: Current ranges for different welding current patterns.
In addition to the two-step pulsating current welding method (Figure 4 above), preheating the sheets at 20-25% of the normal current before beginning the impulses can be effective when joining three layers of extremely different thicknesses. Figure 5 shows a weld cross section using preheating prior to three impulses.
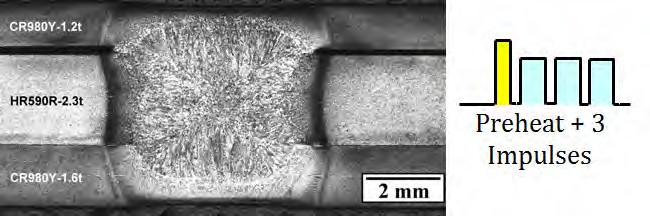
Figure 5: Cross section of three sheet spot weld including preheating prior to pulsations.C-6
Another solution to RSW three sheets is when the Fusion Zone (FZ) formation process is controlled by setting the welding current and welding force during welding in multiple steps; this is referred to as Intelligent Spot Welding. (ISW). Using this approach, nugget formation between a thin sheet and thick sheet becomes possible when reduced welding force is applied. In Step 1 of the welding process, a FZ is reliably formed between the thin sheet and thick sheet by applying conditions of low welding force, short welding time, and high current. In the subsequent Step 2, a FZ is formed between the two thick sheets by apply high welding force and a long welding time. The results are shown in Figure 6, in which welding is performed with the edge of three steel sheets positioned directly under the electrodes, and the behavior of FZ formation at the edge of the sheets was observed with a high-speed video camera. Condition (a) is welding under a constant welding force and condition (b) is ISW. In condition (a), a nugget was formed between the two thick sheets, but the nugget failed to grow to the thin sheet-thick sheet joint, and the two sheets were not welded. However, condition (b) shows that nuggets have formed between both the thin and thick sheet and between the two thick sheets. The optimal welding current range for Step 2 can be determined from nugget formation between the two thick sheets, resulting in a wide available current range equal to or greater than that in joint welding of two thick sheets.
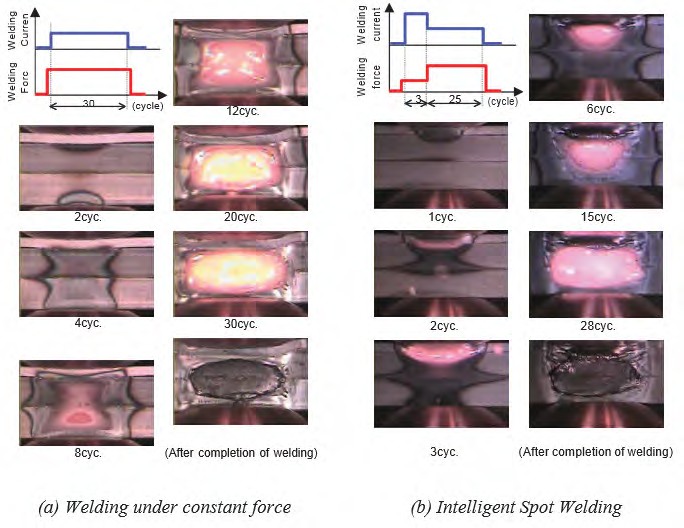
Figure 6: Results of observation of FZ formation phenomenon in RSW of three-sheet joint by high-speed video camera.J-1
Application of Spot Welding to Hollow Members
In spot welding of car bodies, the so-called direct spot welding (in which the welding current is passed while two or more steel sheets are pressed against each other) by the welding electrodes is used most commonly. However, for those parts with closed cross sections, it may become necessary to drill a working hole through which the electrodes for direct spot welding of the steel sheets can be passed. In this case, the decline in rigidity of the drilled part being compensated for by using a thicker steel sheet or providing a reinforcing member will inevitably increase the weight of the car body. Therefore, attempts were made to reduce the steel sheet thickness (weight) and secure the required stiffness simultaneously without drilling any hole in the steel sheets. Indirect spot welding was used, in which the steel sheets are pressed and welded by a couple of electrodes from one side at the same time. Because the steel sheets are pressed by electrodes from one side, the weld sinks and the area of contact between the steel sheets increases (the current density decreases) if an excessive force is applied, making it difficult to perform fusion welding. Conversely, if an excessively large current is applied, the local current density between the electrodes increases because of a shunt current, causing a crack or explosion.
Studies were made for various welding conditions for the combination of a hollow member with a 1.6-mm wall thickness and a sheet-formed member with a 0.7-mm thickness. By using an electrode with a specially designed tip and a DC power supply in combination, indirect spot welding could be performed of the above members without requiring any special pattern of conduction or pressing, even in the presence of a gap between the members or the presence of shunts (existing welding points). An example of the cross section of an indirect spot weld is illustrated in Figure 1, which clearly indicates that a sufficiently large nugget was formed.
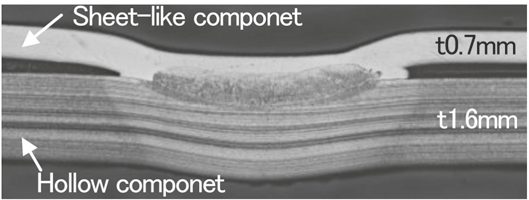
Figure 1: Cross section of indirect spot weld for hollow and sheet-like components.
For the indirect RSW with single-side access of the welding electrode, the variable controls of electrode force and current during welding were developed to promote the weld nugget formation. Experiments as well as numerical simulations were conducted to study the welding phenomena and optimize the welding process. It was verified that the nugget was stably formed with the developed process even when shunting was large. Figure 2 describes the effect of variable current and force on the promotion of weld nugget formation.
At the first stage with low welding current and high electrode force, the electric conduction with sufficient load at weld preheats the sheet, which promotes contacting area between the electrode and upper sheet and thus inhibits the expulsion from the surface. Meanwhile, contacting area between upper and lower sheets is also promoted forming the stable conduction path. Subsequently, at the second stage with high welding current and low electrode force, the nugget formation is effectively promoted with a heated region concentrated at the center in weld, avoiding the further penetration of welding electrode into the upper sheet and thus maintaining the current density.
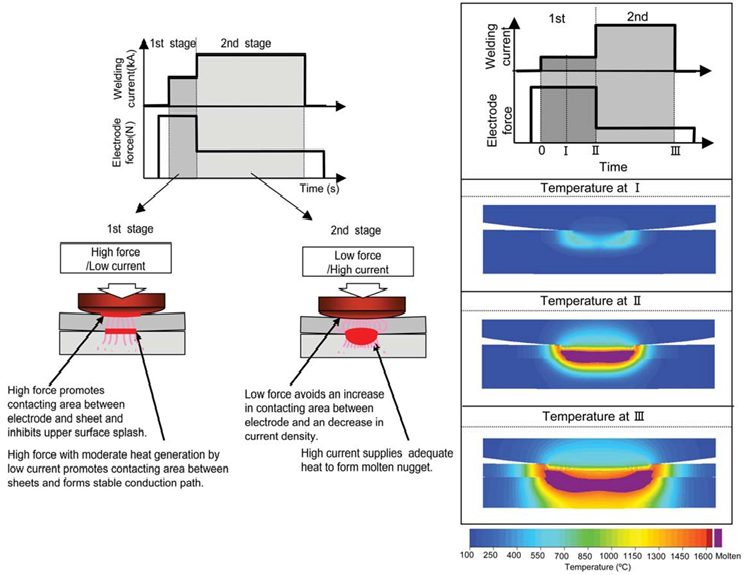
Figure 2: Concept of nugget formation process of variable current and force control for single-sided RSW.J-1
Back To Top
RSW Joint Performance Testing
It has been a long-standing challenge to extend the usage of the very high-strength steels in hydrogen-rich environments, given that these steels are prone to Hydrogen Cracking, due to their increased mechanical strength. Hydrogen embrittlement (HE) is known to be a premature fracture caused by a small amount of hydrogen atoms concentrated at highly stressed regions inside susceptible high tensile strength materials. (See examples in Figure 1.)
Figure 1: Examples of hydrogen embrittlement (HE) failure in RSW.
The factors controlling the occurrence of HE, susceptible microstructure, stress, and the presence of hydrogen, are well known and have been sufficiently quantified to develop procedures that minimize its occurrence mostly in arc welding thicker gauge steels. When advanced high strength steel (AHSS) with tensile strength over 980 MPa are applied in automotive applications, there is a small risk that hydrogen embrittlement fracture (sometime called delayed fracture) may occur after welding, while a vehicle is in use. Although there have been no reports that automotive parts made of AHSS have fractured due to hydrogen embrittlement, a risk assessment of delayed fracture for AHSS is considered necessary to ensure the safety of the automotive body and encourage wider use of Advanced High-Strength Steel (AHSS) sheets.
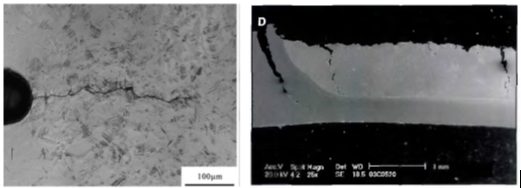
Another common embrittlement phenomenon involves the zinc coating discussed previously. Resistance spot welding is dependent on the interfacial contact resistance between the electrodes and the material. During welding, a metal with a lower melting point, such as zinc can penetrate in a liquid state into the grain boundaries of the material. By the end of the welding process, liquid metal embrittlement (LME) can become a problem due to the ductility of the grain boundary being reduced by the impeding tensile stress. (Example can be seen in Figure 2.) Also, brittle intermetallic compounds, such as Cu5Zn8, are created by the reaction with the Cu electrode and the material at the high temperature, which promotes LME or surface cracking.
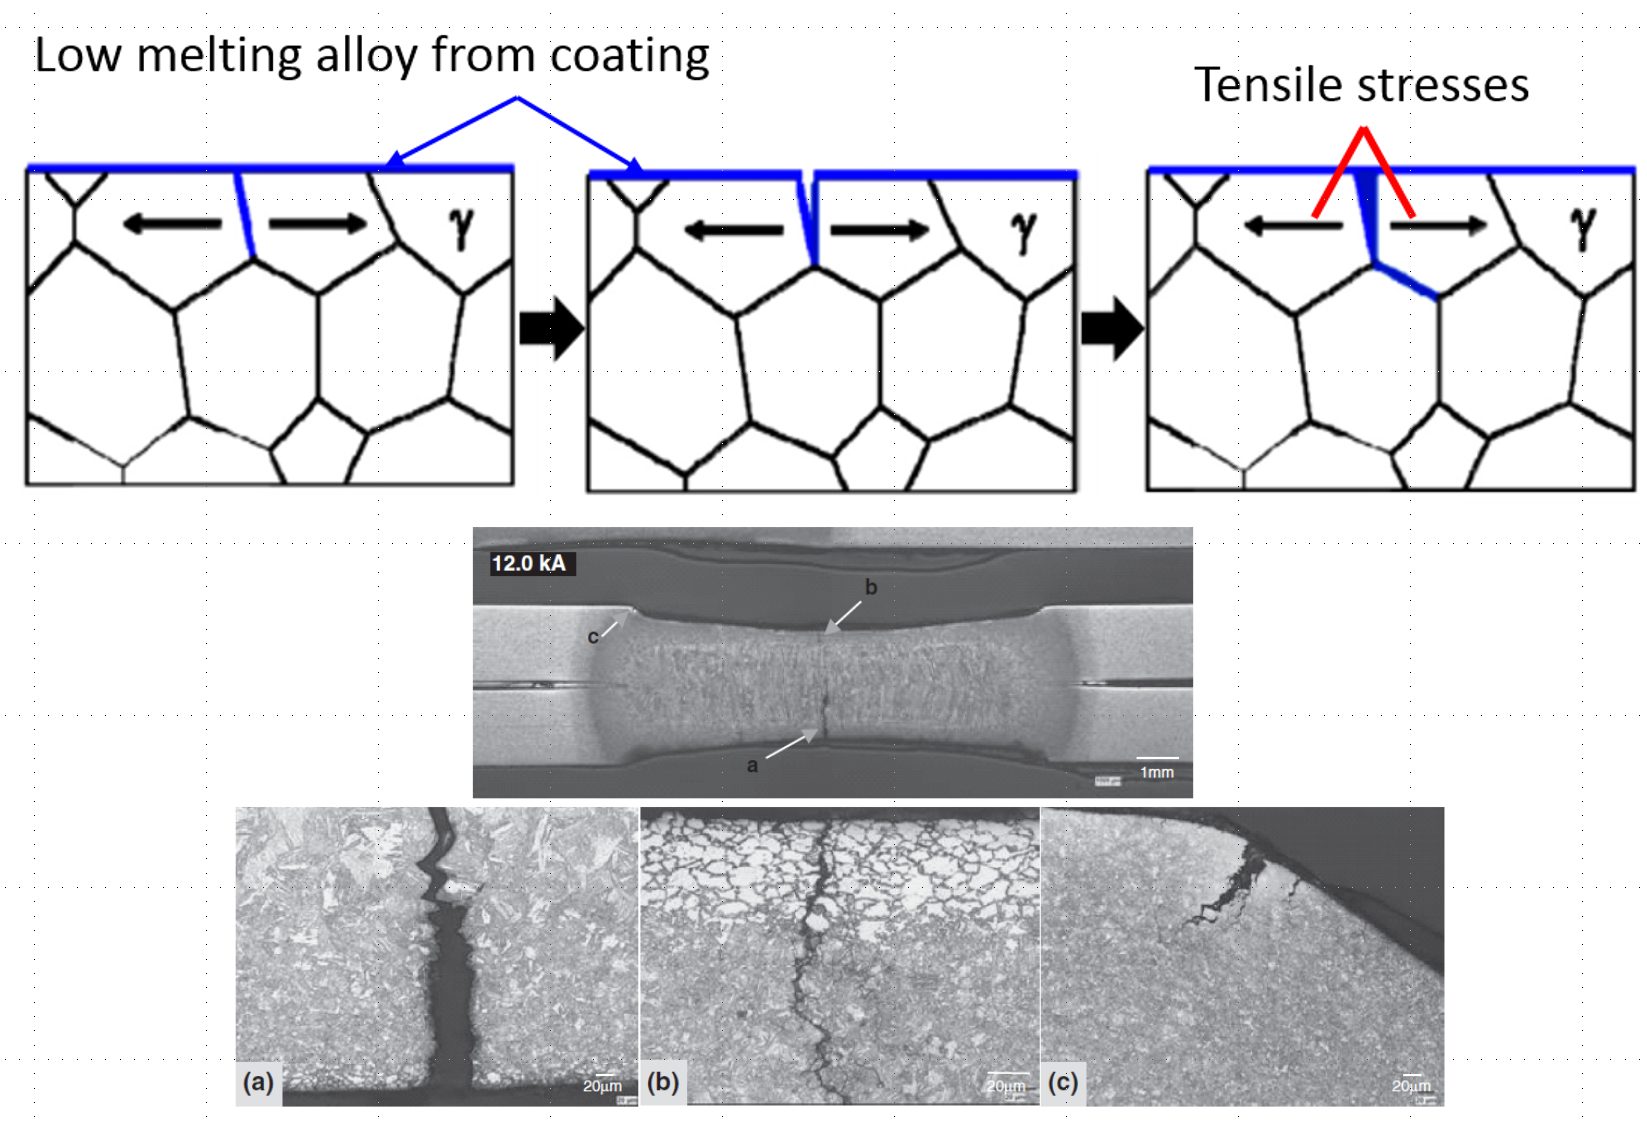
Figure 2: Description of (top image) and actual example (bottom) of the LME phenomenon in zinc coated AHSS.
There are many research papers investigating and analyzing Liquid Metal Embrittlement in mild steel and AHSS. LME is not unique to automotive AHSS steels or RSW, but is discovered in other ferrous materials, heat treatment and other welding processes. In spot welding AHSS, the complex microstructure and the greater spring back behavior of AHSS eventually lead to weld discontinuities such as LME.
A detailed multi-year, multi-organization study investigated the root causes of LME and how to test for, control, and prevent LME. The full report can be downloaded here, and is summarized in an AHSS Insights Blog.
The Joining Team of the Auto/Steel Partnership (A/SP) also recognizes the concerns surrounding LME, and conducted several rounds of testing, summarized here.
A/SP developed two separate procedures to test for Liquid Metal Embrittlement:
In summary, LME cracking may occur when a combination of tensile stress, liquid metal and susceptible microstructure exist. Studies are being performed to evaluate whether LME is mitigated by today’s automotive RSW processes, where the volume of welds significantly exceeds engineering requirements, or whether the occurrence of LME actually affects in-use properties at all.
RSW Joint Performance Testing
The joint strength in the peeling direction begins to decrease when the Base Metal (BM) strength exceeds 780 MPa. It has been found that the Cross-Tension Strength (CTS) of HSS joints could be improved by using appropriate conditions for post-heat conduction. Unlike the conventional tempering process in which the weld is tempered after a sufficient cooling time (i.e., after completion of martensite transformation of the weld), the post-heat conduction process incorporates a short cooling time; hence, it will not cause significant decline in productivity. The post-heat conduction process is described in detail below.
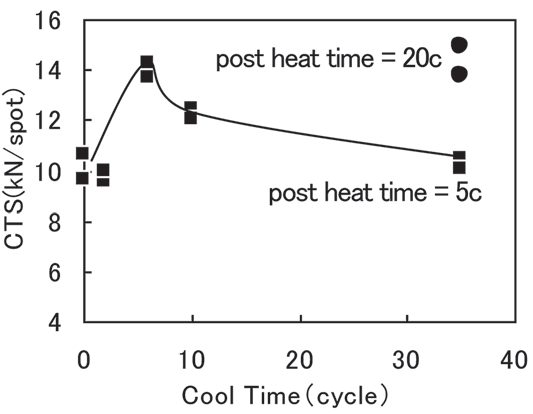
Figure 1 illustrates the effect of cooling time on CTS. It is clear that CTS reaches a peak for a cooling time of 6 cycles and improves when the post-heat conduction time is increased, even when the cooling time is increased to 35 cycles. With the aim of investigating why CTS improved, as described above, the conditions of solidification segregation were analyzed, for example, Mn, Si, and P. An example of P segregation is shown in Figure 2. When post-heat conduction was not performed at all or was performed using the conditions under which CTS did not improve [as shown in Figure 2 (b)], the segregation of P in the same part decreased markedly. One reason for this is thought to be as follows. The element that was solidification- segregated during regular conduction was diffused during the post-heat conduction. As described in the preceding section, it is believed that the toughness of the nugget edge increased, thereby helping to enhance CTS.
Figure 1: Effect of cool time on CTS (HS, 2-0-mm sheet thickness, 5-√t nugget diameter).N-5
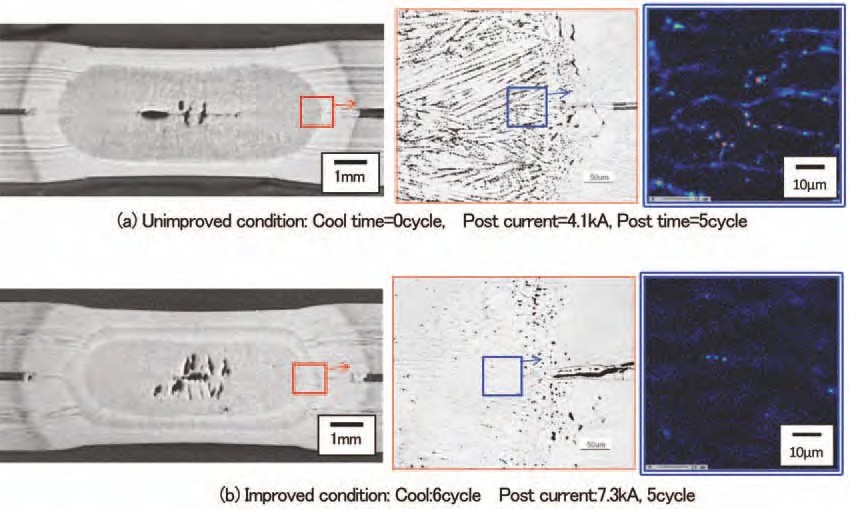
Figure 2: Effect of post-heat conditions on microstructure and solidification segregation at edge of nugget.N-5
The effect of post-heat conduction in easing such solidification segregation is supported by other researchers. It should be noted that the hardness of the nugget interior remains the same, regardless of whether the post-heat conduction is implemented. Therefore, the above improvement in CTS cannot be attributed to the effect of tempering. Conversely, the application of post-heat conduction increased the degree and width of softening of the HAZ. From the standpoint of fracture mechanics, the degree of influence of the widening of soft HAZ on the improvement in CTS was estimated to be about 4%. Therefore, the improvement in CTS by post-heat conduction can be attributed mainly to the enhancement of fracture toughness by the easing of solidification segregation.
Figure 3 shows comparison of CTS between with and without pulse pattern at the nugget diameter. The strength became higher when welded with pulse pattern, especially when the pulse current was between 8 and 9 kA. These results suggest that the pulsation pattern achieved adequate reduction in solidification segregation and soften the HAZ.
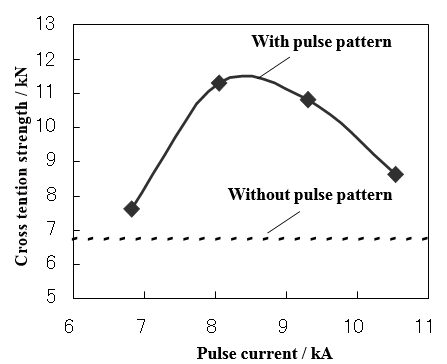
Figure 3: Comparison of CTS with and without pulse pattern.J-1
RSW Joint Performance Testing
In a comparative studyL-6 of the spot weld fatigue strength of various steels grades, some of which included grades such as 1.33-mm Fully Stabilized (FS) 300/420 (HDGA), 1.35-mm DP 340/600 (HDGA), 1.24-mm TRIP 340/600 (HDGA), and 1.41-mm TRIP 340/600 (HDGA), it was concluded that Base Metal (BM) microstructure/properties have relatively little influence on spot weld fatigue behavior (Figure 1). However, DP 340/600 and TRIP 340/600 steels have slightly better spot weld fatigue performance than conventional low-strength Aluminum-Killed Drawing Quality (AKDQ) steels. Further, it was found that the fatigue strength of spot welds is mainly controlled by design factors such as sheet thickness and weld diameter. Therefore, if down-gauging with HSS is considered, design changes should be considered necessary to maintain durability of spot-welded assemblies.
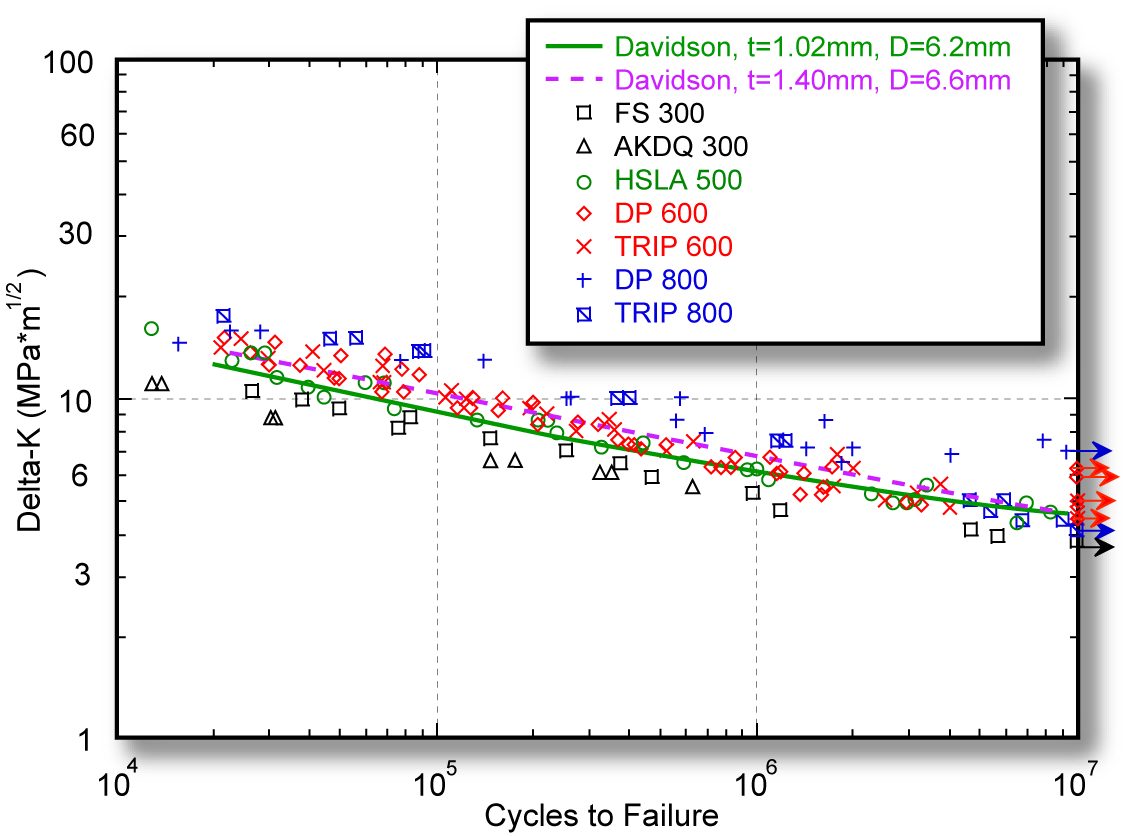
Figure 1: Tensile-shear spot weld fatigue endurance curves for various HSS
(The data are normalized to account for differences in sheet thickness and weld size. Davidson’s data in the plot refer to historical data.L-6).
Similar to mild steel, an increase in the number of welds in AHSS will increase the component fatigue strength (Figure 2). Multiple welds on AHSS will increase the fatigue strength more than mild steel.
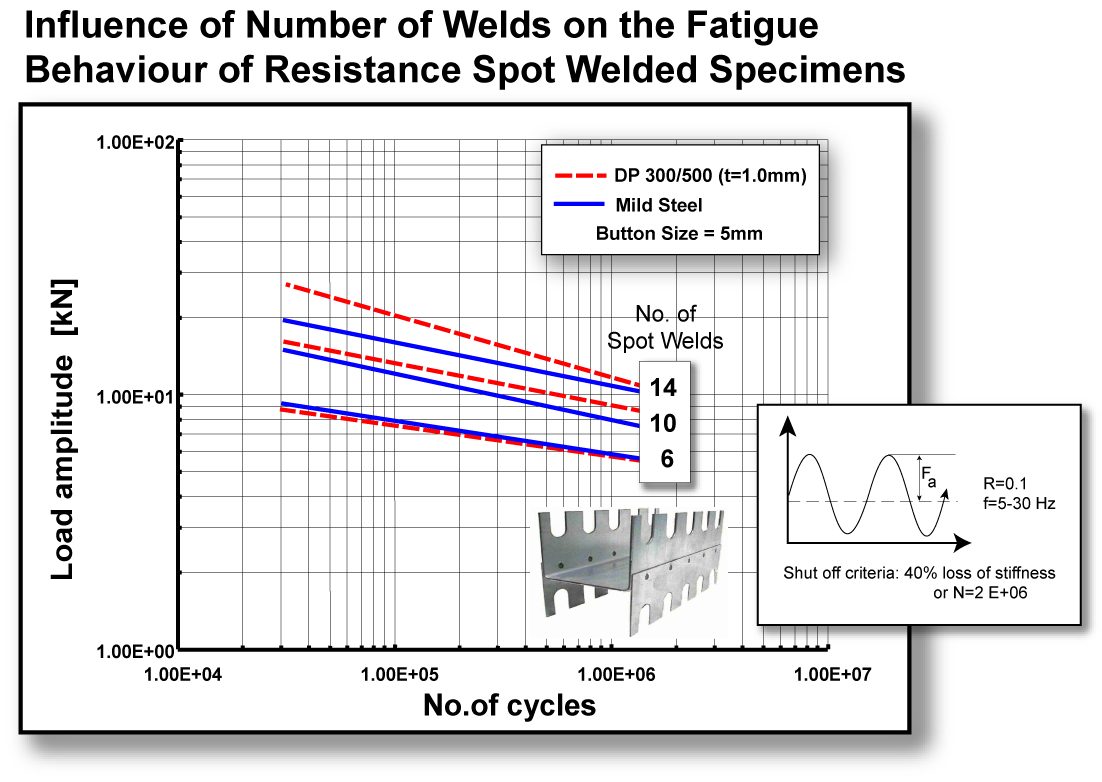
Figure 2: Effect of increase in number of welds in mild steel and DP steel components.S-4
Figure 3 is a representative best-fit curve based on numerous data points obtained from mild steel, DP steels with tensile strengths ranging from 500 to 980 MPa, and MS steel with a tensile strength of 1400 MPa. The curve indicates that the fatigue strength of single spot welds does not depend on the BM strength.
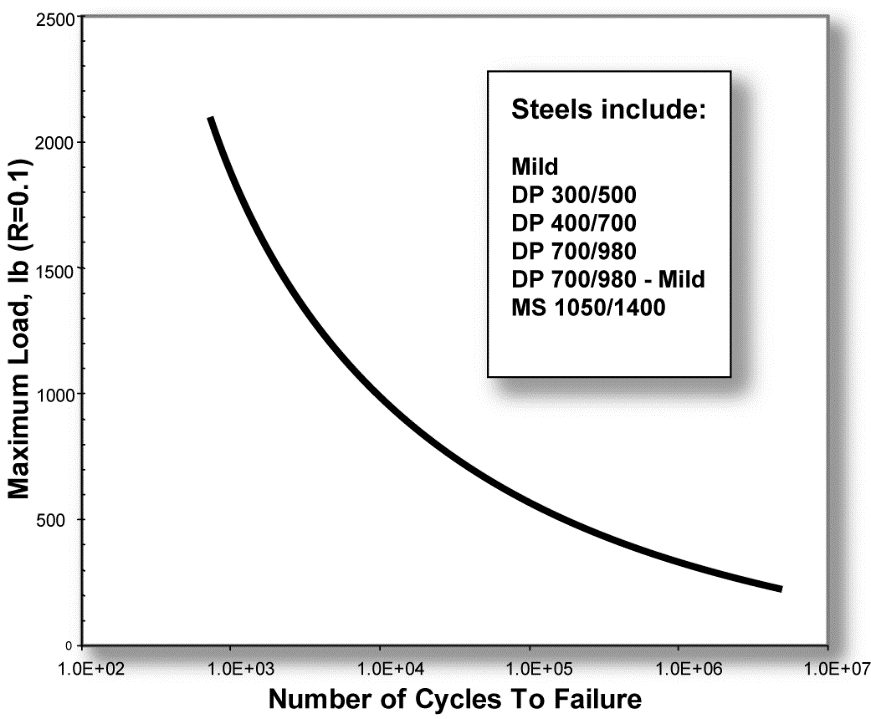
Figure 3: A best-fit curve through many data points for MS, DP steels, and MS steel (Fatigue strength of single spot welds does not depend on BM strength.L-2)
RSW Joint Performance Testing
Peel and chisel testing of resistance spot welds (RSW) in AHSS may produce fracture through the weld during destructive or teardown testing. This type of fracture becomes more common with increasing sheet thickness and BM strength. Weld metal fracture may accompany significant distortion of the metal immediately adjacent to the weld during testing. Such distortion is shown in Figures 1 and 2. Under these conditions weld metal fracture may not accurately predict serviceability of the joint. Weld performance of AHSS depends on microstructure, loading mode, loading rate, and degree of constraint on the weld.
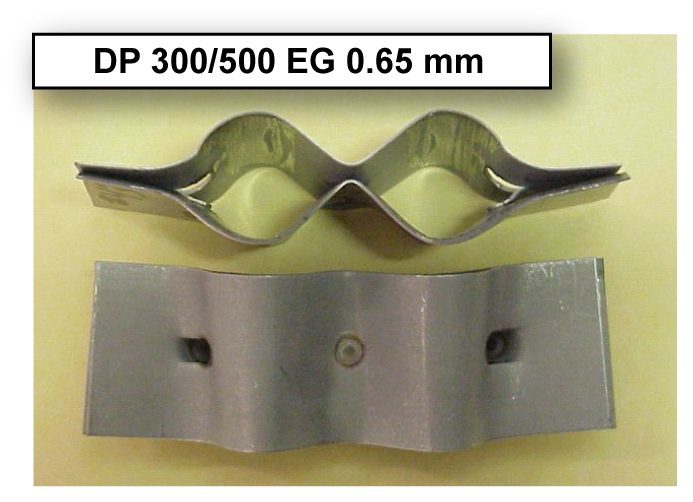
Figure 1: Example of laboratory dynamic destructive chisel testing of DP 300/500 EG 0.65-mm samples.M-1
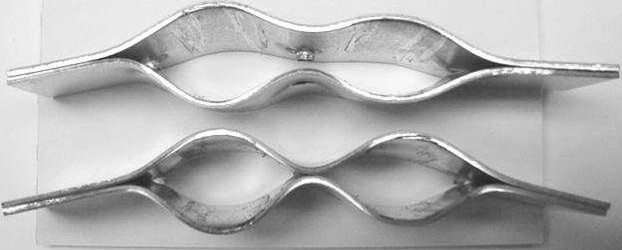
Figure 2: Example of laboratory dynamic destructive chisel testing of DP 350/600 GI 1.4-mm samples.M-1
Additionally, because of inherent stiffness of AHSS sheets, “nondestructive” chisel testing (Figure 3) on AHSS spot-welded panels will deform the panel permanently and may promote weld metal fracture. Therefore, this type of in-process weld check method is not recommended for AHSS with thicknesses greater than 1.0 mm. Alternative test methods should be explored for use in field-testing of spot welds in AHSS.
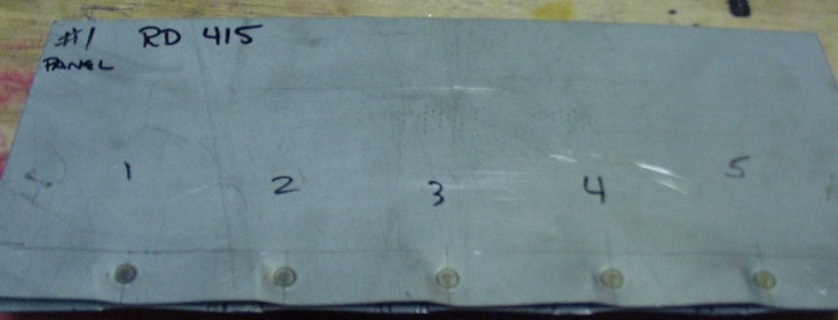
Figure 3: Semi-destructive chisel testing in 0.8-mm DP 300/500 EG.M-1
Ultrasonic nondestructive spot weld testing has gained acceptance with some manufacturers. It still needs further development before it can replace destructive weld testing completely. Some on-line real-time systems to monitor the resistance welding are currently available and are being used in some weld shops.
Weld-Shear Tension Strength
The Advanced High-Strength Steel (AHSS) weld tensile strength is proportional to material tensile properties and is higher than mild steel spot weld strength (Figure 4).
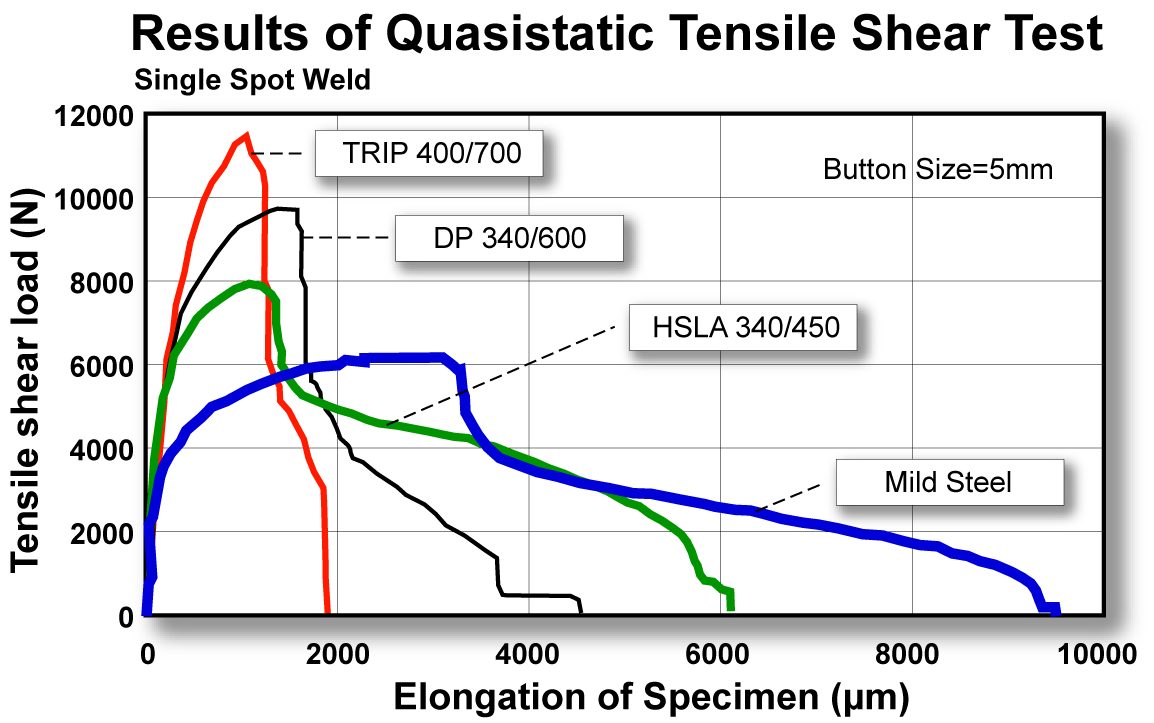
Figure 4: Tensile shear strength of single spot welds.L-4
While testing thick AHSS spot welds (from small button size to expulsion button) the fracture mode during shear-tension testing may change from interfacial to button pull out or plug. Despite interfacial fractures [Figure 5(a)], welds in AHSS may show high load-bearing capacity. In thin-gauge steels, the fracture is often in a button or plug (Figure 6).
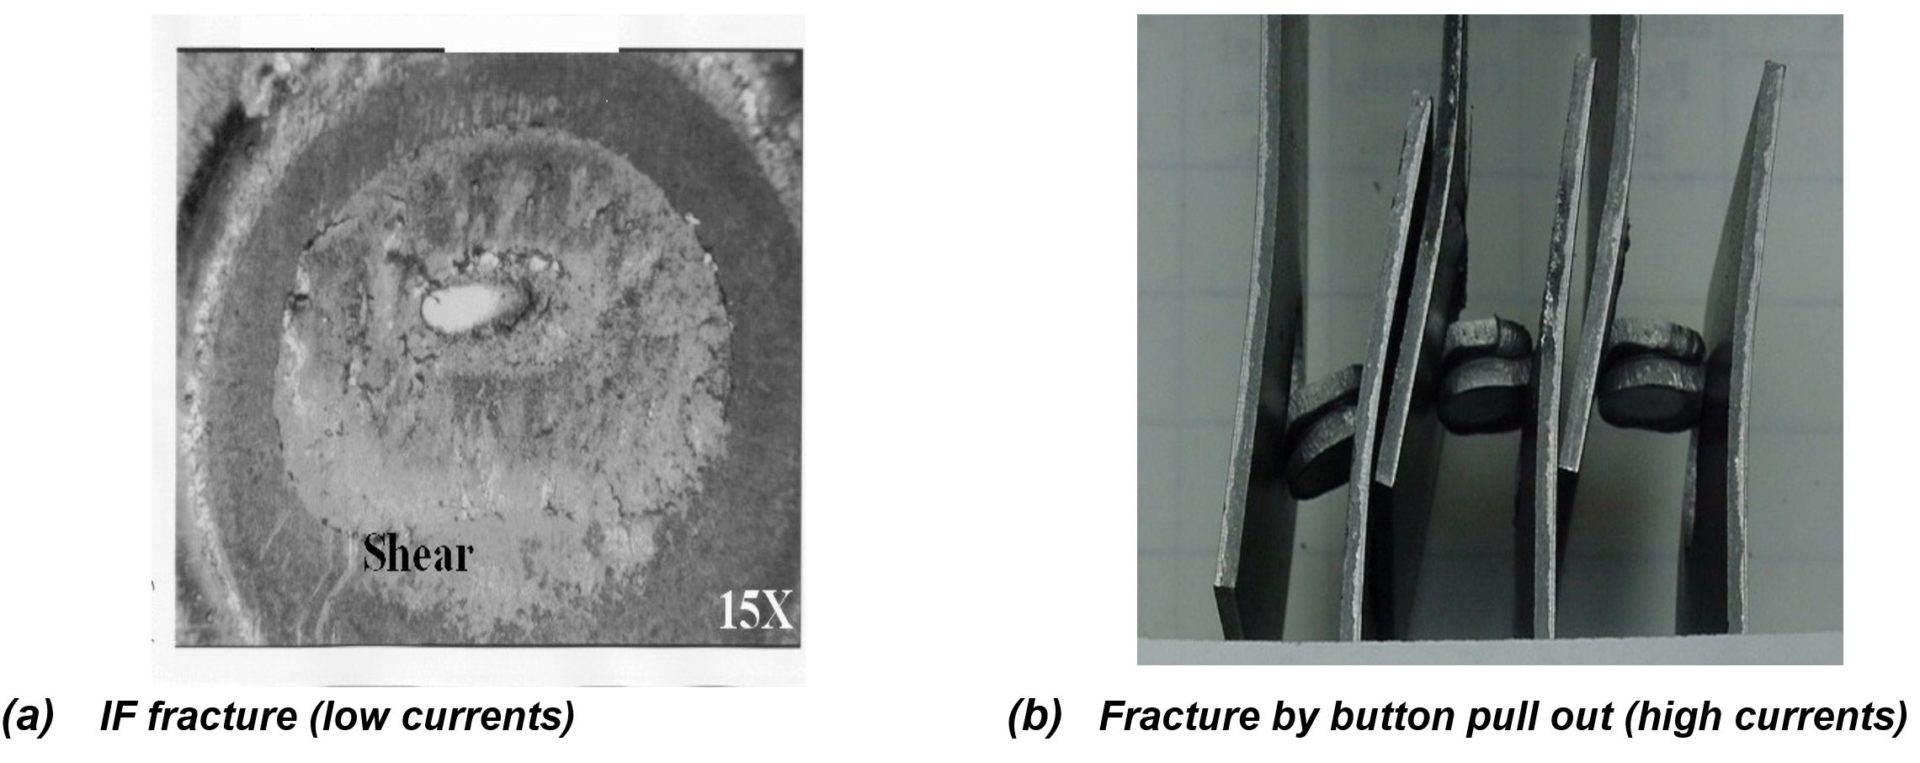
Figure 5: Fracture modes in thick (1.87-mm) DP 700/980 CR during tension-shear testing.
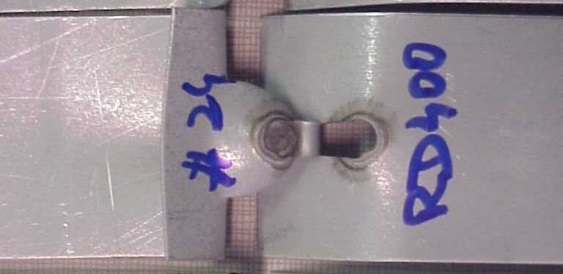
Figure 6: Fracture modes in thin (0.65-mm) DP 300/500 EG during tension-shear testing.L-2
In a studyL-6, Finite-Element Modeling (FEM) and fracture mechanics calculations can be used to predict the RSW fracture mode and loads in shear-tension tests of AHSS. The results were compared to those obtained for an Interstitial Free (IF) steel. The results of the work confirmed the existence of a competition between two different types of fracture modes, namely Full Button Failure (FBF) pull-out and interfacial fracture. The force required to cause a complete weld button pull-out type fracture was found to be proportional to the tensile strength and to the thickness of the BM as well as the diameter of the weld. The force to cause an interfacial weld fracture was related to the fracture toughness of the weld, sheet thickness, and weld diameter. For High-Strength Steels (HSS), it was determined that there is a critical sheet thickness above which the expected fracture mode could transition from pull-out to interfacial fracture. In this analysis, it was shown that, as the strength of the steel increases, the fracture toughness of the weld required to avoid interfacial fracture must also increase. Therefore, despite higher load-carrying capacity due to their high hardness, the welds in HSS may be prone to interfacial fractures. Tensile testing showed that the load-carrying capacity of the samples that failed via interfacial fracture was found to be more than 90% of the load associated with a FBF pull-out. This indicates that the load-bearing capacity of the welds is not affected by the fracture mode. Therefore, the mode of fracture should not be the only criteria used to judge the quality of spot welds. The load-bearing capacity of the weld should be the primary focus in the evaluation of the shear-tension test results in AHSS.
Presently, some steel sheets have tensile strengths of 1,500 MPa or more. Such steels are subjected primarily to hot-press forming. The strengths of spot-welded joints are illustrated in Figure 7. The tensile shear strength of welded joints tends to increase with increasing steel sheet strength. Conversely, the Cross-Tension Strength (CTS) of welded joints tends to decline when the steel sheet strength is 780 MPa or more. This is thought to occur for the following reason. With increasing steel sheet strength, the stress concentration at the nugget edge increases, and nugget ductility and toughness decrease. When the amount of any added element [such as Carbon (C)] is increased in order to secure the desired steel sheet strength, the hardness of the weld metal (nugget) obtained increases; this, in turn, causes the nugget toughness to decrease. Nugget toughness also decreases when the contents of embrittling elements (P and S) are increased. The following equation of equivalent carbon content has been proposed to express the effects of these elements has been known.

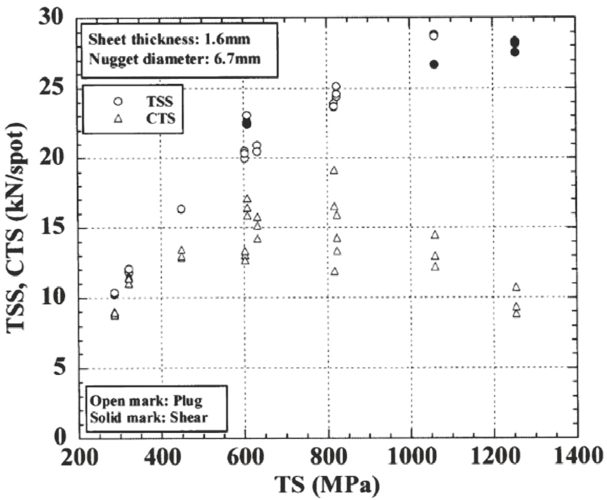
Figure 7: Effect of tensile strength of steel sheet on TSS and CTS of spot-welded joints.
It is believed that C, Silicon (Si), and Manganese (Mn) contribute to the increase in nugget hardness and Phosphorus (P) and Sulfur (S) contribute to the increase in segregation, thereby causing a decline in nugget toughness. The threshold value on the right-hand side represents the strength of a welded joint and the soundness of the fracture mode in a cross-tension test. When the Ceq (spot) is within the range indicated by the above equation, fracture always occur outside the nugget (plug fracture) and CTS is high. However, attempts have been made to enhance CTS by controlling the composition of steel sheet appropriately. It was reported that even when the steel sheet strength is maintained constant, the strength of the weld increases as C content decreases and the Si content increases. This is thought to occur for the following reason. With the increase in C content, the hardness of the weld increases and the sensitivity of the fracture to the stress concentration at the nugget end increases, thereby causing CTS to decline. By contrast, as the content of Si – a hardenability element – is increased, the region that is quench-hardened by Si widens, that is, the change in hardness in the region from the nugget to the BM becomes milder, thereby improving CTS.
According to a well-known material mechanics model, it is expected that the CTS of the spot- welded joints will improve with the increase in steel sheet strength. However, this contradicts the observed phenomenon. Therefore, a cross-tension test was considered based on fracture mechanics and attempted to clarify the dominant factors of CTS.
Understanding the fracture of spot-welded joints in the cross-tension test as a problem of crack propagation from around the nugget, the problem was studied using an elastic-plastic fracture mechanics model in order to obtain a general understanding of fracture, from the ductile fracture to the brittle fracture. According to elastic-plastic fracture mechanics, it is assumed that the crack starts to propagate when the crack propagation driving force (J) around the nugget under a tensile load reaches the fracture toughness (Jc) of the nugget edge. Therefore, it was attempted to derive the value of J and measure the value of Jc of the edge during the cross- tension test.
Figure 8 shows the distribution of maximum principal stress at the nugget edge under a load of 4 kN. The broken line in the figure indicates the fusion line. It is clear that the virtual crack in the edge opened during the deformation. The decline in potential energy that was caused by the opening was divided by the crack area to obtain the value of J. Figure 9 shows the dependence of the J-value on nugget diameter under a load of 5 kN, obtained for each of the two types of cracks. It is clear that, in either cracking direction, the J-value under the same load decreases with the increase in nugget diameter. According to the analysis result obtained for a nugget diameter of 3 √t, the J-value when the crack was allowed to propagate in the interfacial direction was slightly larger than that when the crack was allowed to propagate in the sheet thickness direction. However, for larger nugget diameters (4 and 5 √t), the J-value when the crack was allowed to propagate in the sheet thickness direction became larger than that when the crack was allowed to propagate in the interfacial direction.
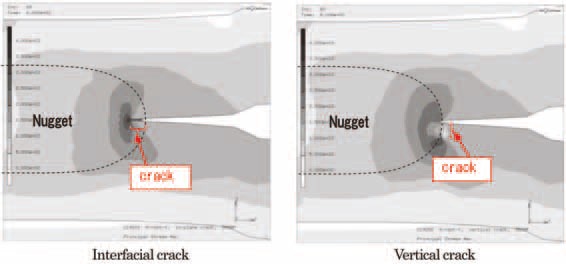
Figure 8: Deformed state and distribution of maximum principal stress at edge of nugget under the lead of 4 kN.N-5
Figure 9: Dependence of J-value on nugget diameter under the load of 5 kN.N-5
In Figure 10, the fractured 0.30% C specimen revealed a grain boundary fracture at the edge and a cleavage fracture surface inside the nugget.
Figure 10: SEM images of fracture surface of miniature CT specimens after testing (0.30 mass % C).N-5
The CTS of welded joints was 2.4 kN for the 0.30% C steel sheet and 6.6 kN for the 0.13% C steel sheet, the ratio between them being 0.38. According to the fracture toughness test results, the fracture stress ratio [Jc (0.30% C)/Jc (0.13% C)]; the square root of J is proportional to stress) is 0.35. Thus, the above ratio was close to the test result. The 0.30% C joint subjected to the cross-tension test revealed a grain boundary fracture at the edge and a cleavage fracture surface inside the nugget.
Fracture Mode
Several automotive and national specifications are using the criterion of fracture modes as an indication of weld quality in production when using AHSS. During peel and chisel testing, results vary from FBF appearance to a complete interface fracture. An example of the various fracture modes experience by the automotive industry is shown in Figure 11.
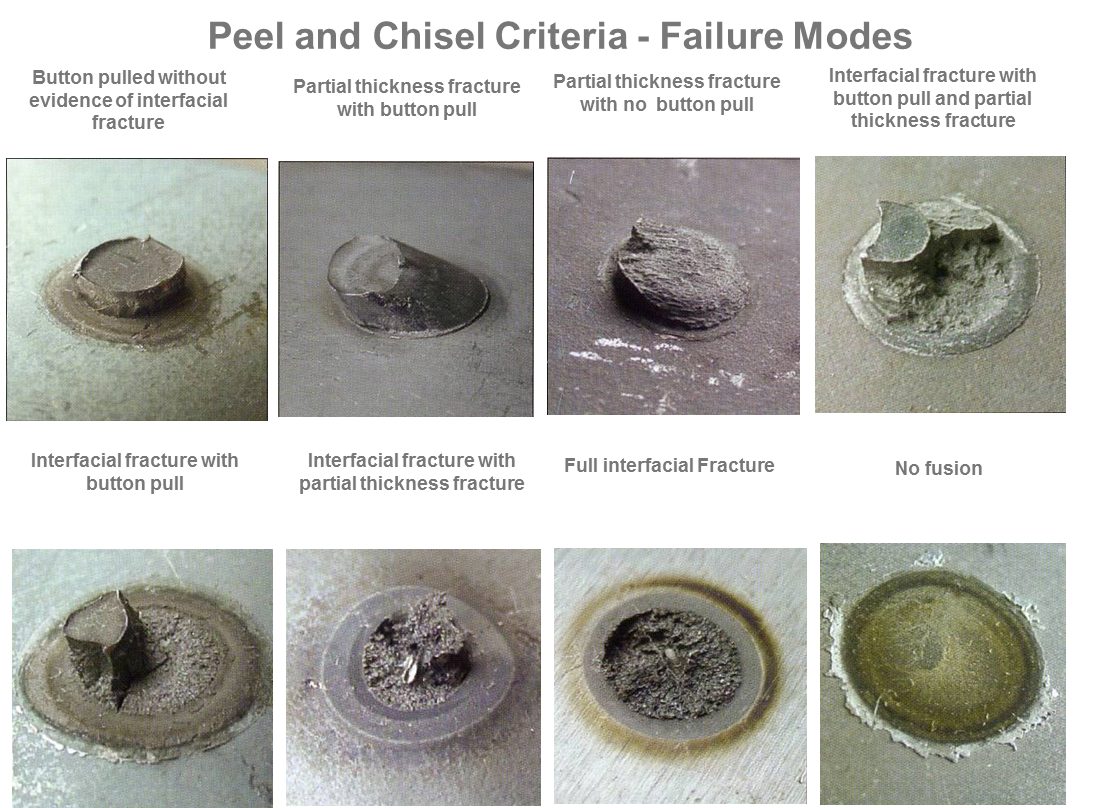
Figure 11: Peel and chisel test fracture modes in automotive industry.
There is an approximate relationship between hardness and fracture mode in resistance spot- welded joints. It is found that peel-type loading of resistance spot-welded joints (e.g., coach peel, cross-tension tensile, and chisel testing) begins to produce partial plug and interfacial fractures at hardness levels exceeding 450 Hardness Value (HV). The relationship between post-weld hardness and fracture mode in peel-type loading is illustrated in Figure 12. It can be seen that there are no set levels of hardness, where one type of fracture mode changes to another type of fracture mode. Instead, there is much overlap between the hardness levels, where specific fracture mode types occur. This indicates that post-weld hardness is not the only factor determining fracture mode.
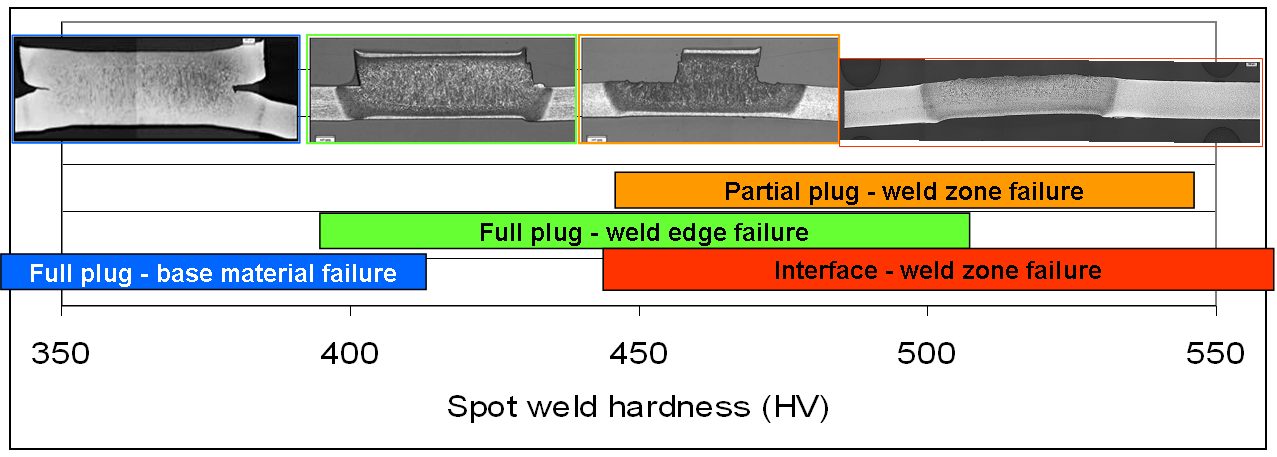
Figure 12: Schematic relationship between RSW hardness and failure mode in peel-type loading.
There are various approaches to predict the fracture of spot welded joints by detailed numerical simulations. However, there are many issues such as the adequate recording of different fracture modes or a numerical methodology for dissimilar welds, which mostly appear in automotive structures. Therefore, a new simulation approach has been developed managing to close the existing gap. This method is based on different damage criteria for each spot weld zone (BM, HAZ, and weld) in order to capture all relevant fracture modes. The model parameters are identified via an inverse method on the basis of simple standardized test (tensile shear tests and peel test), which makes the application efficient. All relevant fracture modes (interfacial fracture and plug fracture) can be detected. A precise prediction of spot welds behavior for similar and dissimilar joints were demonstrated. The results show that the material parameters determined for one sheet thickness are transferable to investigations with differing sheet thicknesses. Consequently, the experimental effort to characterize substitute spot weld models for full car crash simulations can be reduced.
The determination of the specific model parameters for a similar weld combination of DP automotive application steel with a low yield stress and large ultimate strength was presented (thickness of 1.5 mm, ferrite matrix with areas of martensite). A characterization of the plastic flow behavior for each zone is required. For the BM a tensile test provides the flow curve in the region of uniform elongation. In order to capture the plastic flow behavior of the transformed zones in a physical manner, the BM curve is scaled by the averaged hardness change in the HAZ and the weld. To determine the Gurson model parameters for the HAZ, a static peel test is done. This loading results in a high stress concentration in the vicinity of the notch which leads to fracture initiation and evolution in the HAZ. The numerical damage parameters for the HAZ are fitted according to the experiment (Figure 13).
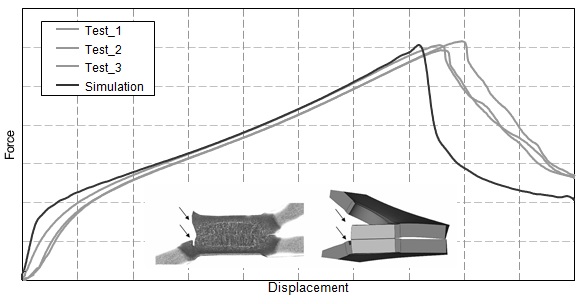
Figure 13: Parameter fitting for HAZ via peel test for DP steels.P-7
Back To Top